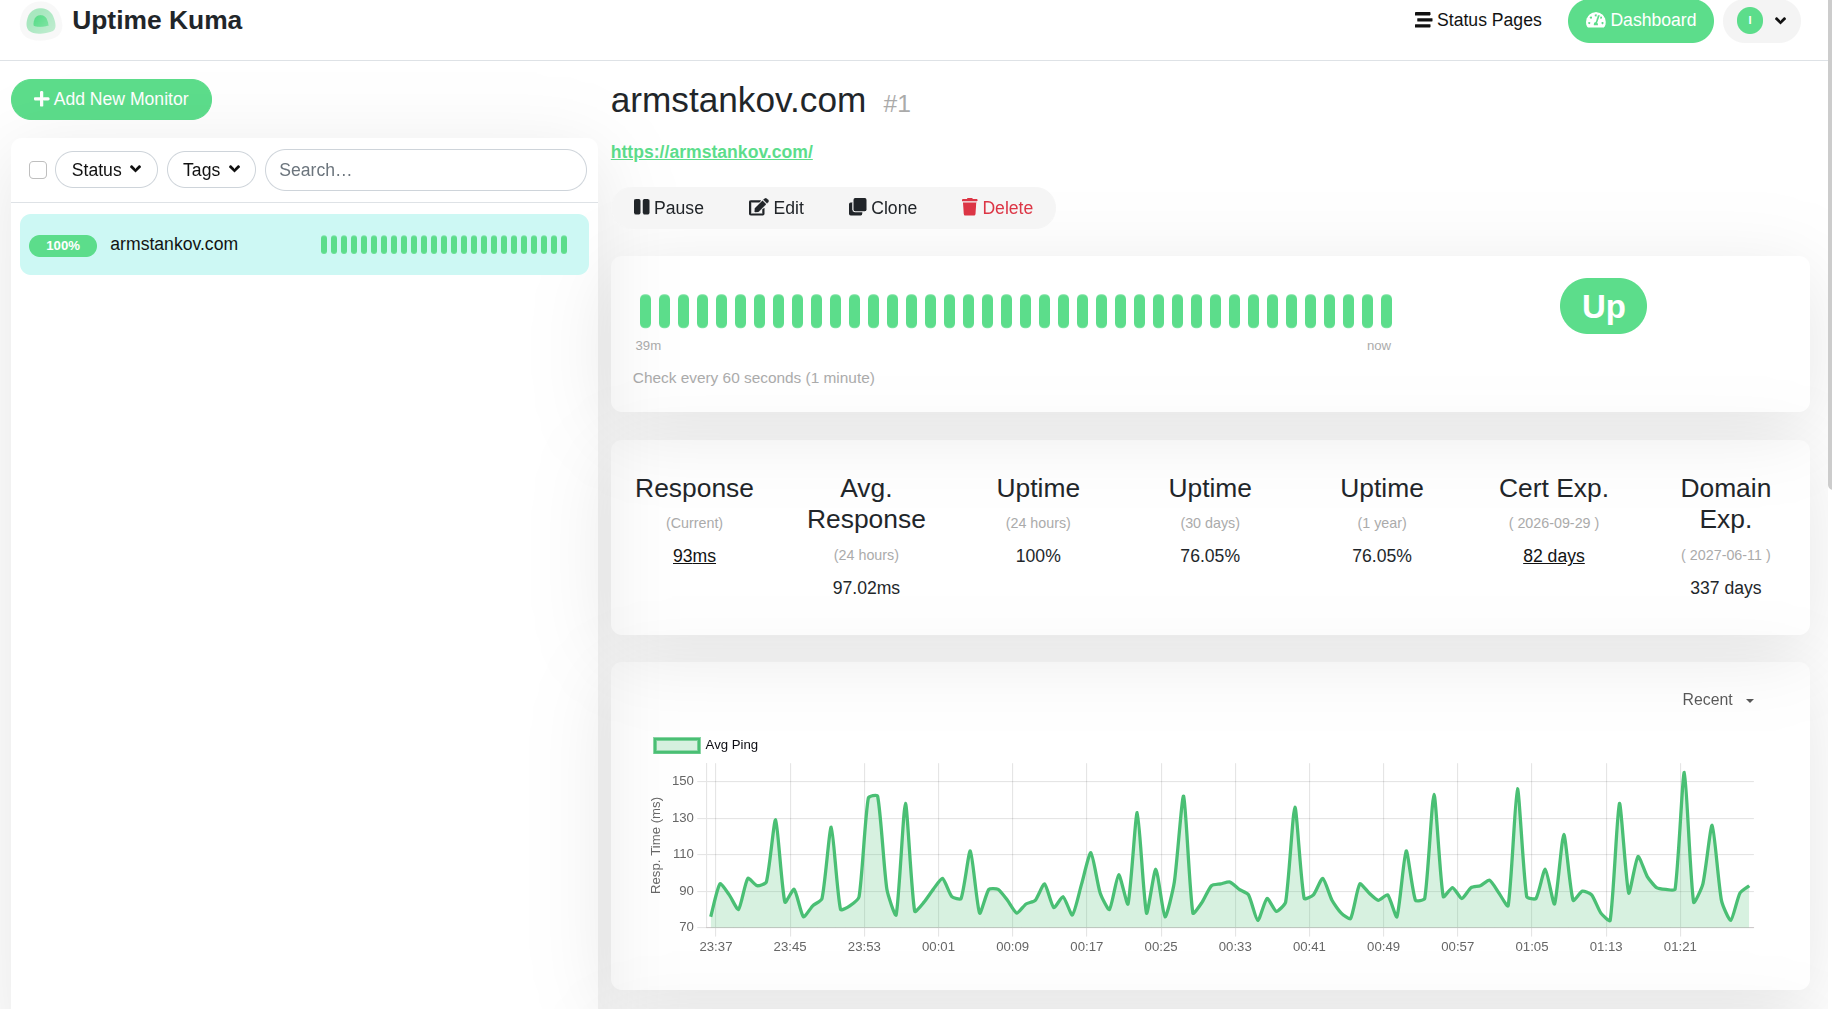
Monitoring internal system health, website uptime, and service APIs is paramount to maintaining a reliable infrastructure. Uptime Kuma is a gorgeous, self-hosted monitoring tool that mirrors the capabilities of premium tools like UptimeRobot, completely open-source and free.
Below is the definitive deployment roadmap for setting up Uptime Kuma v2 inside your personal stack or staging workspace.
Phase 1: Step-by-Step Deployment#
Step 1: Initialize the Work Directory#
Log directly into your server engine via SSH terminal, build out the target configuration application paths, and navigate directly into the workspace:
mkdir -p /DOCKER/uptime-kumacd /DOCKER/uptime-kumaStep 2: Write the compose.yaml Configuration File#
Create your YAML manifest file using a terminal-based editor:
nano compose.yamlPaste your production configurations cleanly into the editor workspace. We map the external dashboard access configuration to port 3001:
YAMLservices:  uptime-kuma:    image: louislam/uptime-kuma:2    container_name: uptime-kuma    restart: unless-stopped    volumes:      - ./data:/app/data    ports:      - "3001:3001"
Save the text formatting adjustments and exit the terminal utility (Ctrl+O, Enter, followed by Ctrl+X).
Step 3: Start the Monitoring Service#
Instruct the Docker engine to pull down the version 2 release tag binaries and spin up your container environment in background detached mode:
docker compose up -dConfirm that your container runtime status is active and safely mapping network sockets:
docker psPhase 2: Detailed Configuration Breakdown & Caveats#
Understanding structural volume mappings and host ports will keep your monitoring software resilient against data loss.
-
Networking & Container Sockets
Ports "3001:3001": Binds your server engine’s public/private host interface on port 3001 directly to internal web app server engine configurations (3001). You can access the main initialization panel via browser layout mapping elements at http://.
-
Lifecycle Configurations
restart: unless-stopped: Instructs the container orchestration engine to automatically spin up your monitoring container loop across underlying server reboots or random host engine service failures—unless explicitly paused manually using docker compose stop.
-
Persistent Volume Allocation
./data:/app/data: Creates a local subdirectory called data/ right inside /DOCKER/uptime-kuma/ to house structural SQLite engines, status metrics, visual histories, and authentication profiles.
Phase 3: Securing with Nginx Proxy Manager (HTTPS Setup)#
Uptime Kuma natively relies on WebSockets to continuously push fluid status check updates straight to your browser screen without requiring page refreshes. Running behind an unencrypted HTTP link will cause modern browsers to kill connection requests or block real-time page changes.
SNIMKAA
To route through Nginx Proxy Manager (NPM) securely, apply these exact settings:
-
Configure the Proxy Host
-
Connect to your active Nginx Proxy Manager dashboard suite.
-
Navigate directly to Hosts > Proxy Hosts and tap Add Proxy Host.
-
Under the Details pane, inject these matching configuration variables:
-
Domain Names: status.yourdomain.com
-
Scheme: http
-
Forward Name/IP: Your server’s interior LAN address (e.g., 192.168.1.50 or host.docker.internal)
-
Forward Port: 3001
-
Block Common Exploits: Toggle ON
-
Websockets Support: Toggle ON (Crucial for live monitoring data stream updates)
-
-
Generate the SSL Certificate
-
Jump to the SSL parameter section of your ongoing proxy build page.
-
Select Request a new SSL Certificate inside the drop-down selector menus.
-
Toggle both Force SSL and HTTP/2 Support to ON.
-
Input your valid maintenance email string to authenticate with Let’s Encrypt, agree to the Terms of Service, and click Save.
-
💡 Note: > You don’t need to use a real email address here. However, if you’d like to receive email notifications, reset your password, etc, it will need to be a real address.
Once NPM establishes domain record checks, your dashboard panel link icon turns green. Open https://status.yourdomain.com to safely access your software suite.
Phase 4: Create Account Panel Setup#
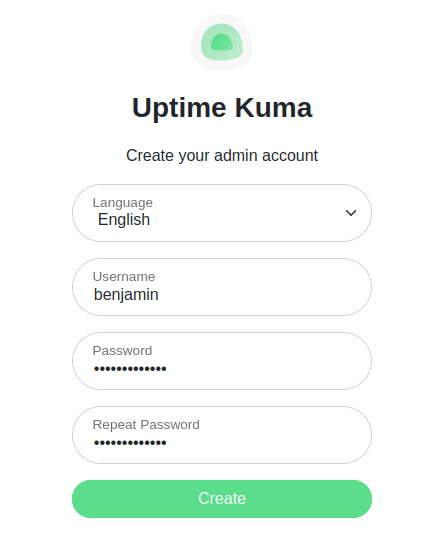
Once you load the secure proxy link for the first time, you will be met with the administrative creation panel to establish initial admin controls.
Fill out the configuration fields as shown below:
Phase 5: Creating Your First HTTPS Monitor#
Once your dashboard configuration is finalized, you can begin tracking your endpoints. Uptime Kuma excels at monitoring websites via standard HTTP/HTTPS protocols, tracking not only response times but also warning you ahead of SSL/TLS certificate expirations.
Here is exactly how to create a monitoring rule like the armstankov.com example:
1. Configure the Target Settings#
- Click the [+ Add New Monitor] button in the top left corner.
- Select Monitor Type:
HTTP(s)from the dropdown list. - Complete the initialization parameters:
- Friendly Name:
armstankov.com - URL:
https://armstankov.com/ - Heartbeat Interval:
60seconds (This ensures a health check executes once every minute)
- Friendly Name:
Scroll down to the bottom of the monitor settings panel and make sure Expiry Notification under the Certificate Validation section is enabled. Tap Save.